Hello,
I need to feed a pie chart IWCGJQPlot with some data caming from a DataSet.
This DataSet is formed by record with two fields: "Label" (string) and "Value" (Currency).
Which is the best way to accomplish this task ?
I saw the V2 demo but I'm not able to create at runtime the array structure you used in the source.
Thank you,
Davide
Feed plot series data from DataSet
17 posts
• Page 1 of 2 • 1, 2
Hi
JQPlot works with json data.
But the demo is working with json as plain strings:
Which are not very workable.
So, assuming that in
"Value" has already the percentage, here's how you can do it:
JQPlot works with json data.
But the demo is working with json as plain strings:
- Code: Select all
  IWCGJQPlot2.JQPlotData := '[[[''Heavy Industry'', 12],[''Retail'', 9], [''Light Industry'', 14],[''Out of home'', 16],' +
    '[''Commuting'', 7],[''Orientation'', 9]]]';
Which are not very workable.
So, assuming that in
"Label" (string) and "Value" (Currency).
"Value" has already the percentage, here's how you can do it:
- Code: Select all
uses
  IWCGJSSuperObject;

procedure TIWJQPlotFrame.SetPieDonut;
var
  LabelField: TField;
  ValueField: TField;
  PlotData: ISuperObject;
  LayerData: ISuperObject;
  SerieData: ISuperObject;
begin
  PlotData:= SA([]);

  LayerData:= SA([]);

  LabelField:= myDataSet.FieldByName('Label');
  ValueField:= myDataSet.FieldByName('Value');
  myDataSet.DisableControls;
  try
    myDataSet.First;
    while not myDataSet.Eof do
    begin
      SerieData:= SA([]);
      SerieData.AsArray.Add(SO(LabelField.AsString));
      SerieData.AsArray.Add(SO(ValueField.AsFloat));
      LayerData.AsArray.Add(SerieData);
      myDataSet.Next;
    end;
  finally
    myDataSet.EnableControls;
  end;

  PlotData.AsArray.Add(LayerData);
  IWCGJQPlot1.JQPlotData := PlotData.AsJSon;

  // Random options
  IWCGJQPlot1.JQPlotOptions.SeriesDefaults.Renderer:= jqprPieRenderer;
  IWCGJQPlot1.JQPlotOptions.SeriesDefaults.PieRendererOptions.ShowDataLabels:= True;
  IWCGJQPlot1.JQPlotOptions.Legend.Show:= True;
  IWCGJQPlot1.JQPlotOptions.Legend.Location:= jqpooE;
end;
- Jorge Sousa
- Posts: 4261
- Joined: 17 May 2012 09:58
You can also use the same method for json creation and use RemoteData instead
Best Regards
Best Regards
- Jorge Sousa
- Posts: 4261
- Joined: 17 May 2012 09:58
Hi
This is my TestCase that first field in table contain a date that define in string type.
When remove "/" character, plot showed,otherwise plot dont show anything.
How to i set it for show?
Best Regards.
This is my TestCase that first field in table contain a date that define in string type.
When remove "/" character, plot showed,otherwise plot dont show anything.
How to i set it for show?
Best Regards.
You do not have the required permissions to view the files attached to this post.
- ariopax
- Posts: 123
- Joined: 07 Dec 2014 21:09
- Location: Tehran,Iran
Hi ariopax,
Please check our demo with JQPlot.
There, you will find the examples with dates.
Best Regards.
Please check our demo with JQPlot.
There, you will find the examples with dates.
Best Regards.
Group: Developers | Support Team
- info [at] cgdevtools.com - General information
- sales [at] cgdevtools.com - Sales department
- support [at] cgdevtools.com - Product and Technical Support
-

Alexander Bulei - Site Admin
- Posts: 3635
- Joined: 15 May 2012 08:52
- Location: Mealhada, Portugal
Hi
How to i set axe that exactly show this item on axe.
(94/01 94/02 94/03 94/04 94/05 94/06 94/07).Of course when i read from Query!
I use this code when i want draw plot.
But when I read from query and use blew code i dont see anything.
Best Regards.
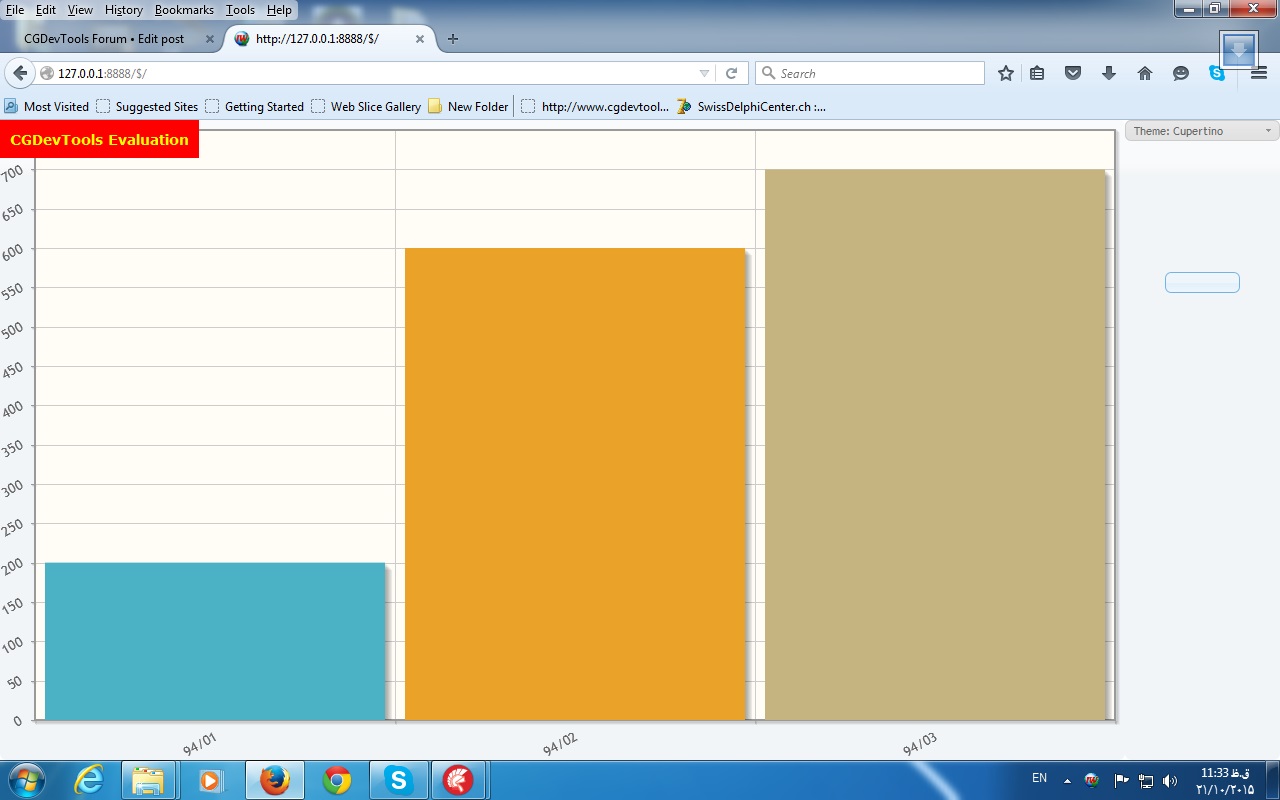
How to i set axe that exactly show this item on axe.
(94/01 94/02 94/03 94/04 94/05 94/06 94/07).Of course when i read from Query!
I use this code when i want draw plot.
- Code: Select all
  IWCGJQPlot1.JQPlotData:= '[[["94/01",200],["94/02",600],["94/03",700]]]';
  IWCGJQPlot1.JQPlotOptions.SeriesDefaults.Renderer:= jqprBarRenderer;
  IWCGJQPlot1.JQPlotOptions.SeriesDefaults.BarRendererOptions.VaryBarColor:= True;
  IWCGJQPlot1.JQPlotOptions.AxesDefaults.TickRenderer:= jqptrCanvasAxisTickRenderer;
  IWCGJQPlot1.JQPlotOptions.AxesDefaults.TickCanvasAxisOptions.Angle:= -30;
  Axis:= IWCGJQPlot1.JQPlotOptions.Axes.Add;
  Axis.AxisType:= jqpoxyXAxis;
  Axis.Options.AxesRender:= jqparCategoryAxisRenderer;
  IWCGJQPlot1.AjaxReRender();
But when I read from query and use blew code i dont see anything.
- Code: Select all
ADOQuery1.Active:=True;
  PlotData:= SA([]);
  LayerData:= SA([]);
  LabelField:=adoquery1.FieldByName('ID');
  ValueField:=adoquery1.FieldByName('Nu');
  adoquery1.DisableControls;
  try
    adoquery1.First;
    while not adoquery1.Eof do
    begin
      SerieData:= SA([]);
      SerieData.AsArray.Add(SO(LabelField.AsString));
      SerieData.AsArray.Add(SO(ValueField.AsString));
      LayerData.AsArray.Add(SerieData);
      adoquery1.Next;
    end;
  finally
  adoquery1.EnableControls;
  end;
  PlotData.AsArray.Add(LayerData);

  IWCGJQPlot1.JQPlotData := PlotData.AsJSon;
  IWCGJQPlot1.JQPlotOptions.SeriesDefaults.Renderer:= jqprBarRenderer;
  IWCGJQPlot1.JQPlotOptions.SeriesDefaults.BarRendererOptions.VaryBarColor:= True;
  IWCGJQPlot1.JQPlotOptions.AxesDefaults.TickRenderer:= jqptrCanvasAxisTickRenderer;
  IWCGJQPlot1.JQPlotOptions.AxesDefaults.TickCanvasAxisOptions.Angle:= -30;
  AxisItem:= IWCGJQPlot1.JQPlotOptions.Axes.Add;
  AxisItem.AxisType:= jqpoxyXAxis;
  AxisItem.Options.AxesRender:= jqparCategoryAxisRenderer;
  IWCGJQPlot1.AjaxReRender();

 ADOQuery1.Active:=False;
Best Regards.
- ariopax
- Posts: 123
- Joined: 07 Dec 2014 21:09
- Location: Tehran,Iran
Hi ariopax,
Please debug and compare the data.
Special attention to array in array:
Best Regards.
Please debug and compare the data.
Special attention to array in array:
- Code: Select all
IWCGJQPlot1.JQPlotData:= '[[["94/01",200],["94/02",600],["94/03",700]]]';
Best Regards.
Group: Developers | Support Team
- info [at] cgdevtools.com - General information
- sales [at] cgdevtools.com - Sales department
- support [at] cgdevtools.com - Product and Technical Support
-
Alexander Bulei - Site Admin
- Posts: 3635
- Joined: 15 May 2012 08:52
- Location: Mealhada, Portugal
Hi
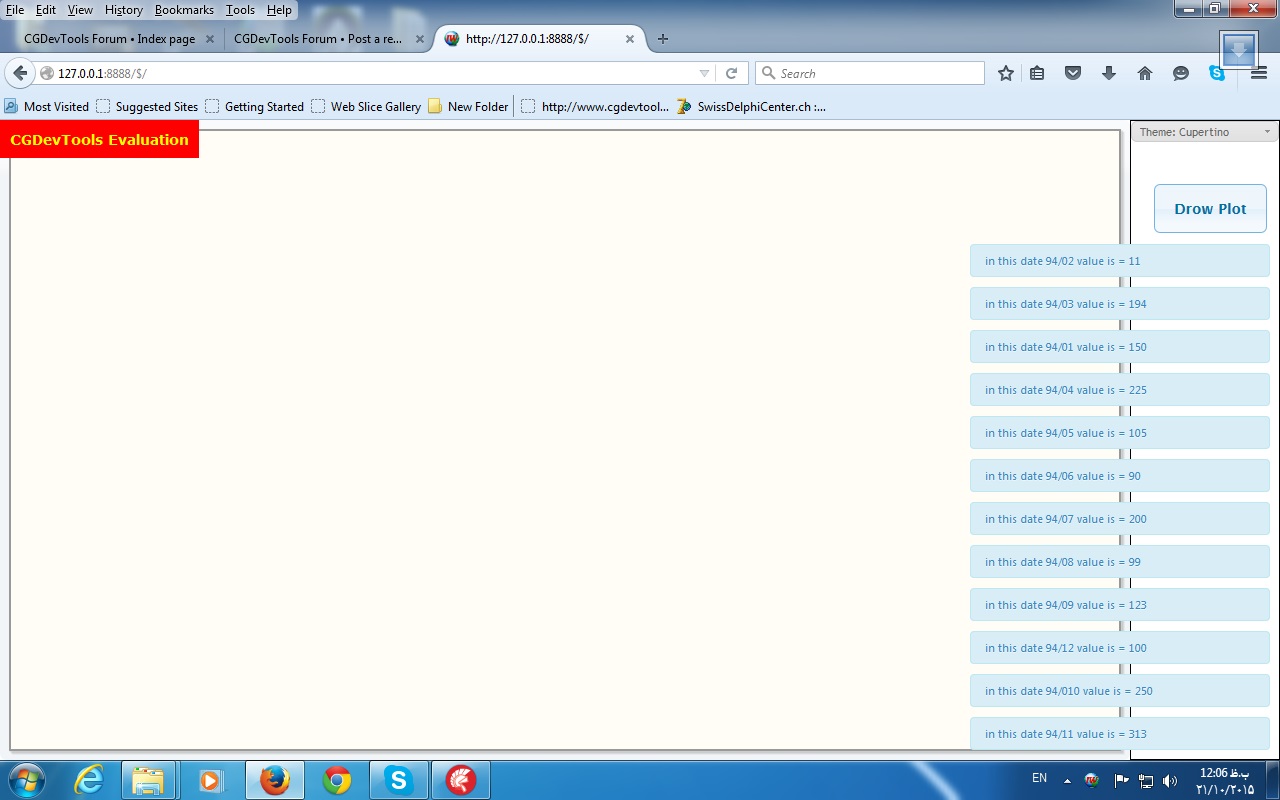
I want explain exactly that what i do,and show a code with picture that i use same code for draw plot .But when reading data that have value from query i can't draw plot.
I with showmessage see my data that read from query.and as you see all fields have value.
Best Regards.
I want explain exactly that what i do,and show a code with picture that i use same code for draw plot .But when reading data that have value from query i can't draw plot.
I with showmessage see my data that read from query.and as you see all fields have value.
Best Regards.
- ariopax
- Posts: 123
- Joined: 07 Dec 2014 21:09
- Location: Tehran,Iran
Hi ariopax,
Yeah, right, but show me the final json string?
Yeah, right, but show me the final json string?
Group: Developers | Support Team
- info [at] cgdevtools.com - General information
- sales [at] cgdevtools.com - Sales department
- support [at] cgdevtools.com - Product and Technical Support
-
Alexander Bulei - Site Admin
- Posts: 3635
- Joined: 15 May 2012 08:52
- Location: Mealhada, Portugal
Hi
This is my TestCase,that in it i read from query for draw plot.and i use same code (explained).
Best Regards.
This is my TestCase,that in it i read from query for draw plot.and i use same code (explained).
Best Regards.
You do not have the required permissions to view the files attached to this post.
- ariopax
- Posts: 123
- Joined: 07 Dec 2014 21:09
- Location: Tehran,Iran
17 posts
• Page 1 of 2 • 1, 2