Page 1 of 2
Feed plot series data from DataSet

Posted:
27 Nov 2013 12:46by Davide
Hello,
I need to feed a pie chart IWCGJQPlot with some data caming from a DataSet.
This DataSet is formed by record with two fields: "Label" (string) and "Value" (Currency).
Which is the best way to accomplish this task ?
I saw the V2 demo but I'm not able to create at runtime the array structure you used in the source.
Thank you,
Davide
Re: Feed plot series data from DataSet
Posted:
27 Nov 2013 13:32by Jorge Sousa
Hi
JQPlot works with json data.
But the demo is working with json as plain strings:
- Code: Select all
  IWCGJQPlot2.JQPlotData := '[[[''Heavy Industry'', 12],[''Retail'', 9], [''Light Industry'', 14],[''Out of home'', 16],' +
    '[''Commuting'', 7],[''Orientation'', 9]]]';
Which are not very workable.
So, assuming that in
"Label" (string) and "Value" (Currency).
"Value" has already the percentage, here's how you can do it:
- Code: Select all
uses
  IWCGJSSuperObject;

procedure TIWJQPlotFrame.SetPieDonut;
var
  LabelField: TField;
  ValueField: TField;
  PlotData: ISuperObject;
  LayerData: ISuperObject;
  SerieData: ISuperObject;
begin
  PlotData:= SA([]);

  LayerData:= SA([]);

  LabelField:= myDataSet.FieldByName('Label');
  ValueField:= myDataSet.FieldByName('Value');
  myDataSet.DisableControls;
  try
    myDataSet.First;
    while not myDataSet.Eof do
    begin
      SerieData:= SA([]);
      SerieData.AsArray.Add(SO(LabelField.AsString));
      SerieData.AsArray.Add(SO(ValueField.AsFloat));
      LayerData.AsArray.Add(SerieData);
      myDataSet.Next;
    end;
  finally
    myDataSet.EnableControls;
  end;

  PlotData.AsArray.Add(LayerData);
  IWCGJQPlot1.JQPlotData := PlotData.AsJSon;

  // Random options
  IWCGJQPlot1.JQPlotOptions.SeriesDefaults.Renderer:= jqprPieRenderer;
  IWCGJQPlot1.JQPlotOptions.SeriesDefaults.PieRendererOptions.ShowDataLabels:= True;
  IWCGJQPlot1.JQPlotOptions.Legend.Show:= True;
  IWCGJQPlot1.JQPlotOptions.Legend.Location:= jqpooE;
end;
Re: Feed plot series data from DataSet
Posted:
27 Nov 2013 13:33by Jorge Sousa
You can also use the same method for json creation and use RemoteData instead
Best Regards
Re: Feed plot series data from DataSet
Posted:
17 Oct 2015 07:55by ariopax
Hi
This is my TestCase that first field in table contain a date that define in string type.
When remove "/" character, plot showed,otherwise plot dont show anything.
How to i set it for show?
Best Regards.
Re: Feed plot series data from DataSet
Posted:
20 Oct 2015 12:17by Alexander Bulei
Hi ariopax,
Please check our demo with JQPlot.
There, you will find the examples with dates.
Best Regards.
Re: Feed plot series data from DataSet
Posted:
21 Oct 2015 06:59by ariopax
Hi
How to i set axe that exactly show this item on axe.
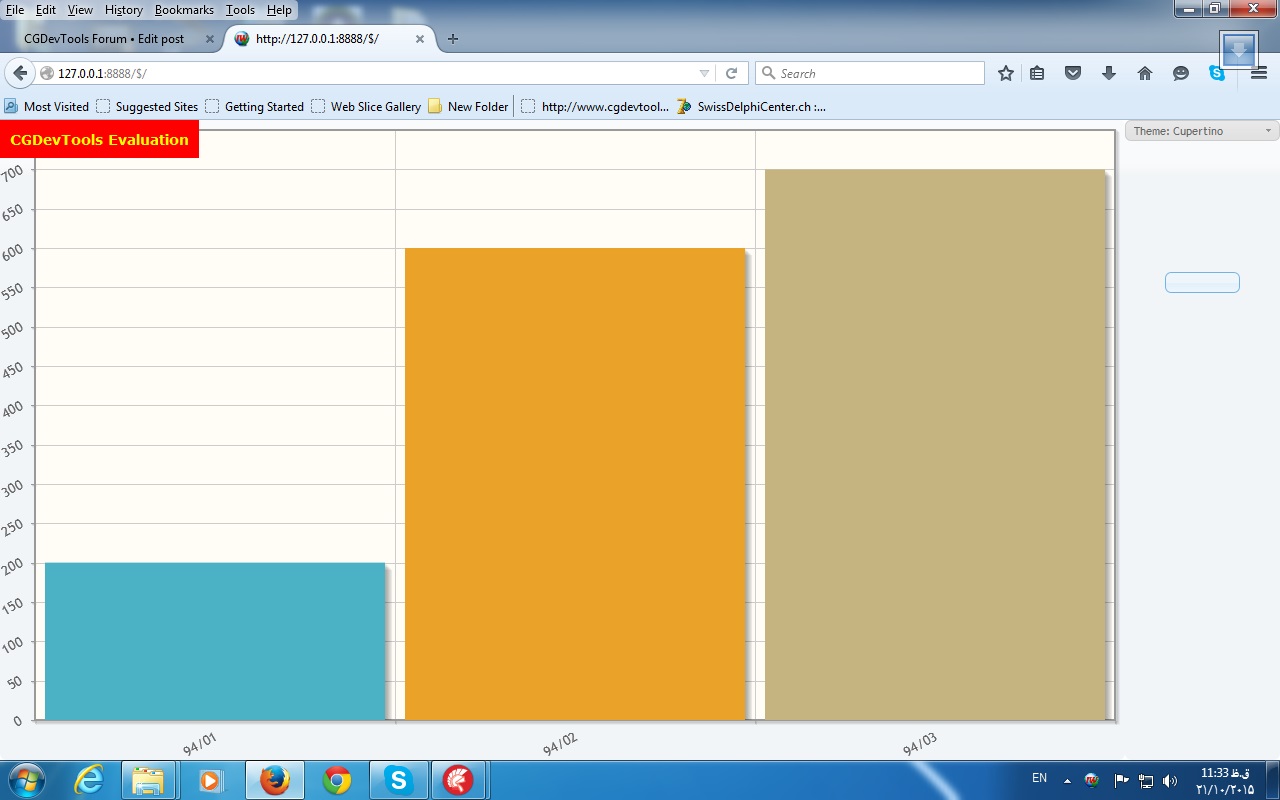
(94/01 94/02 94/03 94/04 94/05 94/06 94/07).Of course when i read from Query!
I use this code when i want draw plot.
- Code: Select all
  IWCGJQPlot1.JQPlotData:= '[[["94/01",200],["94/02",600],["94/03",700]]]';
  IWCGJQPlot1.JQPlotOptions.SeriesDefaults.Renderer:= jqprBarRenderer;
  IWCGJQPlot1.JQPlotOptions.SeriesDefaults.BarRendererOptions.VaryBarColor:= True;
  IWCGJQPlot1.JQPlotOptions.AxesDefaults.TickRenderer:= jqptrCanvasAxisTickRenderer;
  IWCGJQPlot1.JQPlotOptions.AxesDefaults.TickCanvasAxisOptions.Angle:= -30;
  Axis:= IWCGJQPlot1.JQPlotOptions.Axes.Add;
  Axis.AxisType:= jqpoxyXAxis;
  Axis.Options.AxesRender:= jqparCategoryAxisRenderer;
  IWCGJQPlot1.AjaxReRender();
But when I read from query and use blew code i dont see anything.
- Code: Select all
ADOQuery1.Active:=True;
  PlotData:= SA([]);
  LayerData:= SA([]);
  LabelField:=adoquery1.FieldByName('ID');
  ValueField:=adoquery1.FieldByName('Nu');
  adoquery1.DisableControls;
  try
    adoquery1.First;
    while not adoquery1.Eof do
    begin
      SerieData:= SA([]);
      SerieData.AsArray.Add(SO(LabelField.AsString));
      SerieData.AsArray.Add(SO(ValueField.AsString));
      LayerData.AsArray.Add(SerieData);
      adoquery1.Next;
    end;
  finally
  adoquery1.EnableControls;
  end;
  PlotData.AsArray.Add(LayerData);

  IWCGJQPlot1.JQPlotData := PlotData.AsJSon;
  IWCGJQPlot1.JQPlotOptions.SeriesDefaults.Renderer:= jqprBarRenderer;
  IWCGJQPlot1.JQPlotOptions.SeriesDefaults.BarRendererOptions.VaryBarColor:= True;
  IWCGJQPlot1.JQPlotOptions.AxesDefaults.TickRenderer:= jqptrCanvasAxisTickRenderer;
  IWCGJQPlot1.JQPlotOptions.AxesDefaults.TickCanvasAxisOptions.Angle:= -30;
  AxisItem:= IWCGJQPlot1.JQPlotOptions.Axes.Add;
  AxisItem.AxisType:= jqpoxyXAxis;
  AxisItem.Options.AxesRender:= jqparCategoryAxisRenderer;
  IWCGJQPlot1.AjaxReRender();

 ADOQuery1.Active:=False;
Best Regards.
Re: Feed plot series data from DataSet
Posted:
21 Oct 2015 09:33by Alexander Bulei
Hi ariopax,
Please debug and compare the data.
Special attention to array in array:
- Code: Select all
IWCGJQPlot1.JQPlotData:= '[[["94/01",200],["94/02",600],["94/03",700]]]';
Best Regards.
Re: Feed plot series data from DataSet
Posted:
21 Oct 2015 09:45by ariopax
Hi
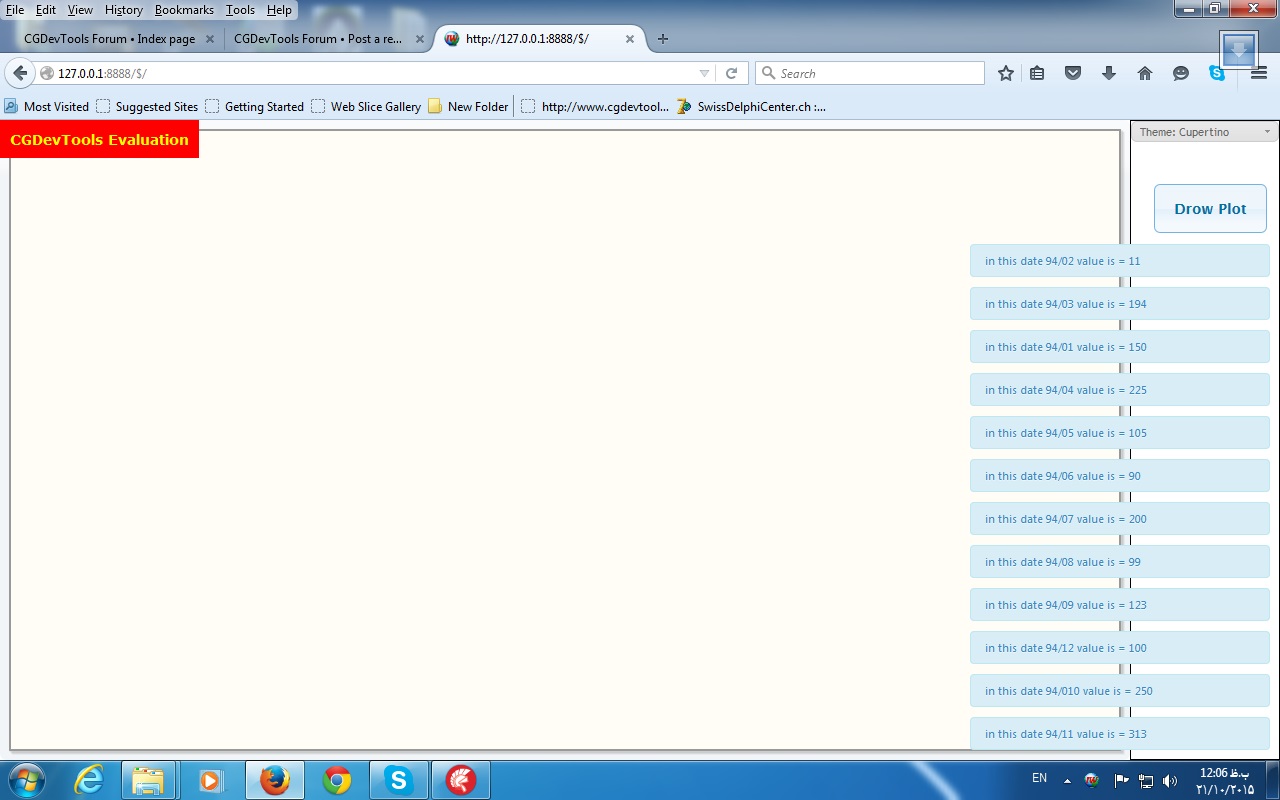
I want explain exactly that what i do,and show a code with picture that i use same code for draw plot .But when reading data that have value from query i can't draw plot.
I with showmessage see my data that read from query.and as you see all fields have value.
Best Regards.
Re: Feed plot series data from DataSet
Posted:
21 Oct 2015 09:48by Alexander Bulei
Hi ariopax,
Yeah, right, but show me the final json string?
Re: Feed plot series data from DataSet
Posted:
21 Oct 2015 09:55by ariopax
Hi
This is my TestCase,that in it i read from query for draw plot.and i use same code (explained).
Best Regards.